LORE GROUP
Their challenge
Despite being a long-term Board platform client with 200 licenses, Lore Group struggled to unlock its full potential. Technical complexity, fragmented data sources, and low confidence in data accuracy led to repeated delays and stalled adoption. Without a trusted single source of truth, teams hesitated to rely on the system—putting the investment and stakeholder confidence at risk.
Our solution
To restore momentum, we proposed a strategic reset: building on Lore Group’s existing investment while addressing the root causes of delay. We developed a centralised Data Hub tailored for strategic reporting, KPI analysis, and financial insights. By completing and extending the data integration layer, we unified multiple sources into a single, automated pipeline.
We rebuilt the reporting suite for clarity and actionability, implemented rigorous testing to ensure data integrity, and introduced tailored onboarding to drive adoption.
The result: a trusted, scalable reporting foundation that empowers confident decision-making and supports future growth.
Lore Group is a hospitality brand known for designing, transforming, and operating distinctive hotels, restaurants, and bars across Europe and the United States. With a focus on creating memorable guest experiences, Lore Group blends bold design with operational excellence. Behind the scenes, they rely on smart, scalable systems to manage complex operations across multiple properties, ensuring consistency, efficiency, and a seamless guest journey
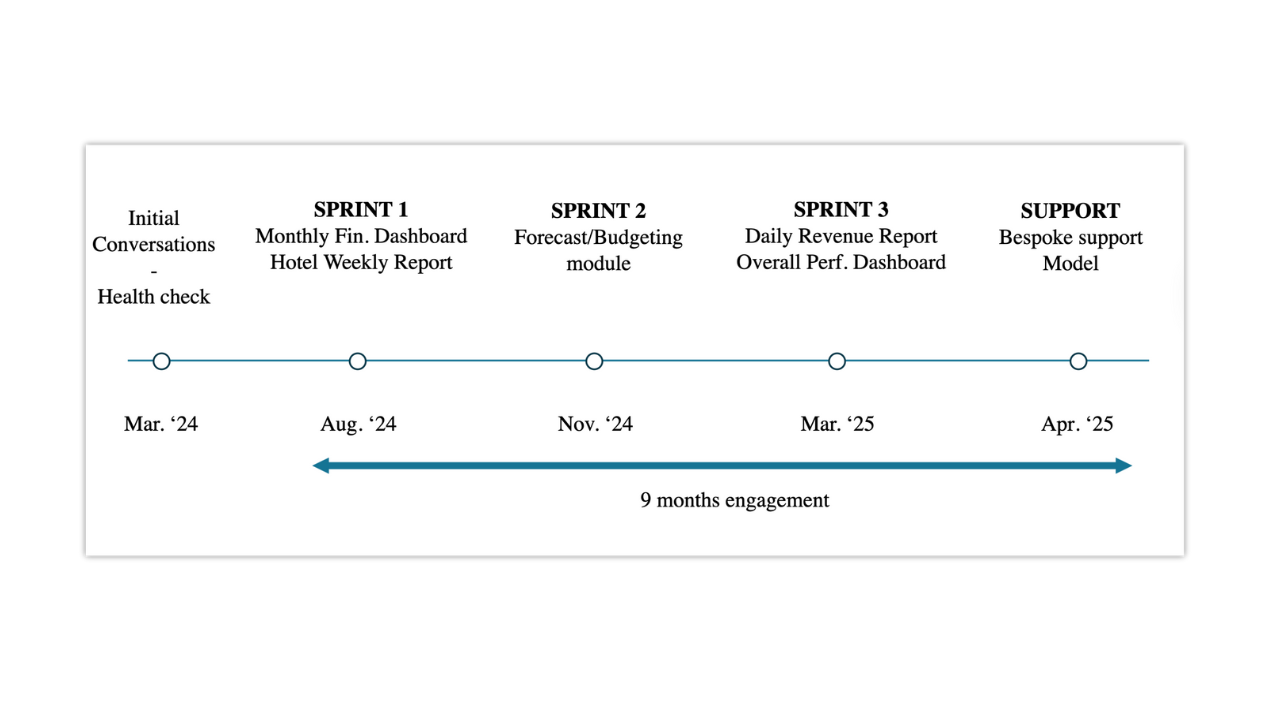
The timeline
The Results
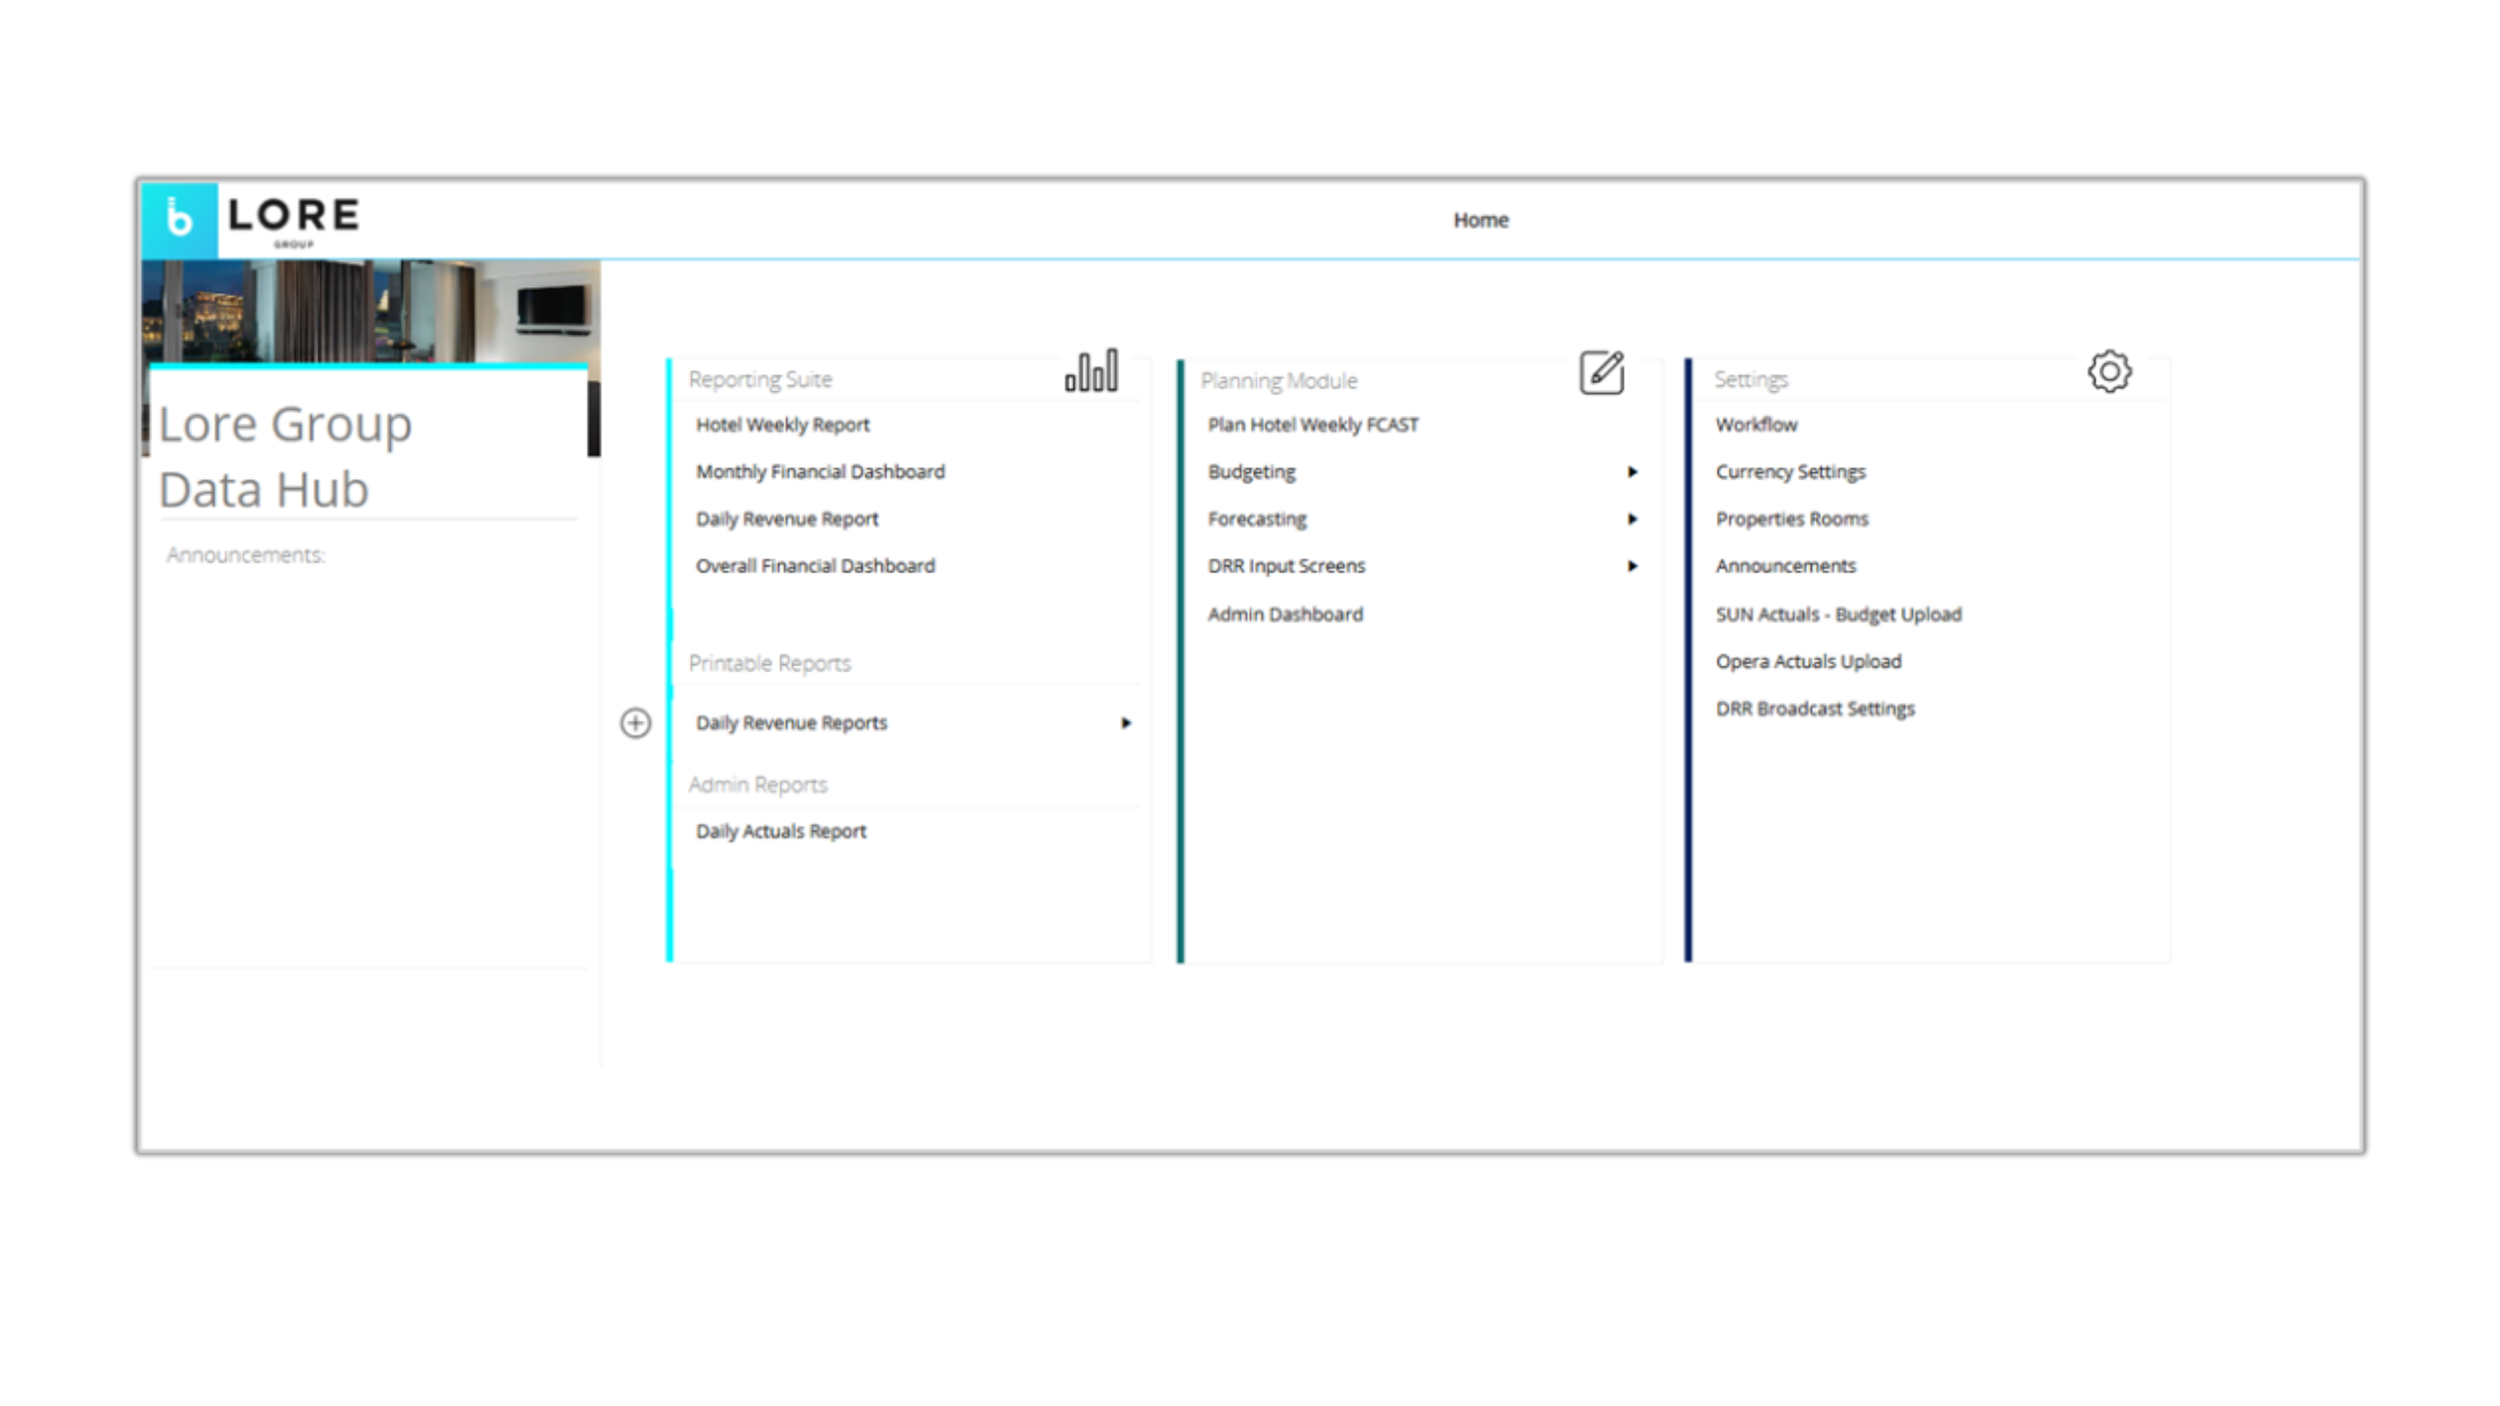
Lore Group has a suite of reports that cover the reporting needs across their financial and hotel departments daily, weekly and monthly
Key Modules
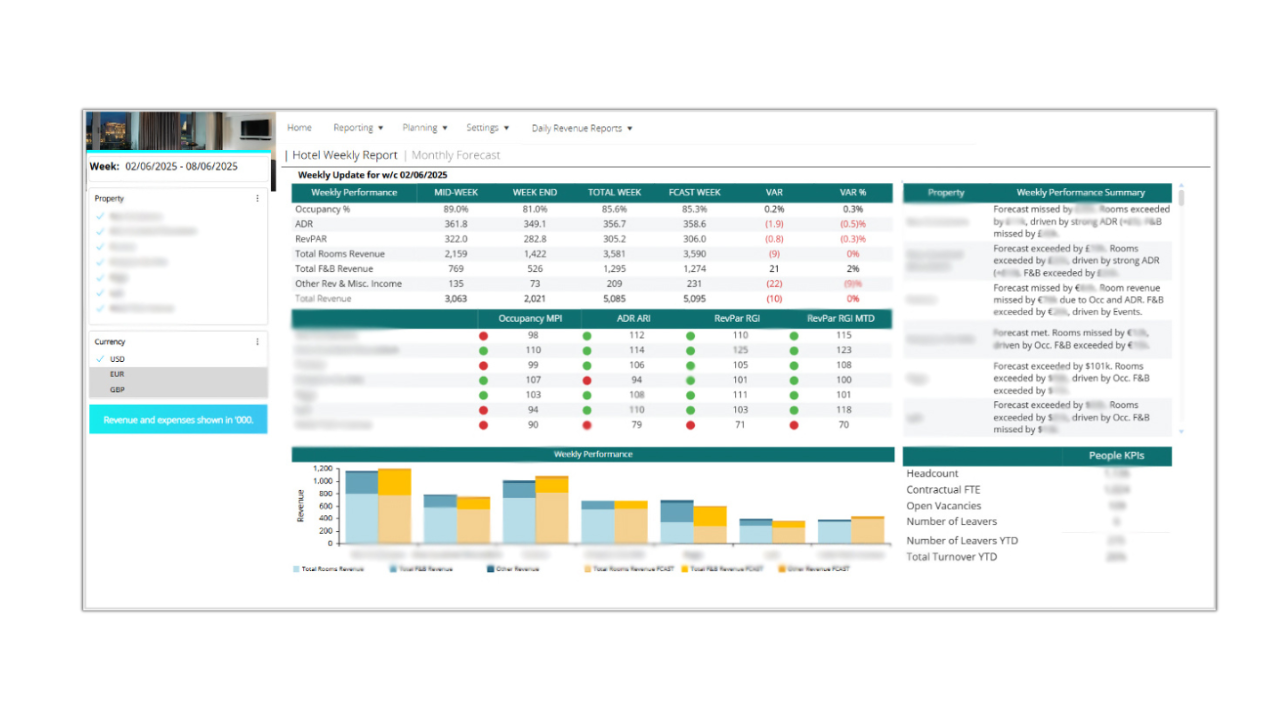
Hotel Weekly Report
Monthly Financial Dashboard
Daily Revenue Report
Overall Financial Dashboard
Budget/Forecast module

Key Benefits
Data Consolidated across properties
Easier reconciliation
Data insights become intuitive
Data is easy to access
Insights shared across finance analysts and Hotel directors
The transformation
Propriety Group delivered a powerful transformation for Lore Group: data is now fully consolidated across properties, reconciliation is seamless, and insights are more intuitive than ever. With easy access to accurate information, finance analysts and hotel directors are aligned and empowered to make faster, smarter decisions.