
Key Metrics for a Finance Dashboard: A Strategic Guide for 2026

If your current reporting feels more like a history lesson than a roadmap, you aren't alone. Many executives spend hours reconciling fragmented data across systems only to end up with a perspective that lacks the precision needed for today's market. With the federal funds rate holding at 3.64 percent and inflation at 3.3 percent as of May 2026, relying on outdated information is a risk you can't afford. Identifying the right key metrics for a finance dashboard is the first step toward reclaiming your time and your confidence in the future.
We understand the frustration of looking at a forecast and feeling a lingering doubt about its accuracy. You deserve a single source of truth that aligns your financial strategy with your operational reality. This guide offers a meticulous look at the essential metrics that transform raw data into a powerful, forward-looking tool. You'll discover how to move beyond simple record-keeping to embrace a visionary approach that supports proactive leadership and long-term security. We will break down how to bridge the gap between fragmented systems and predictive insights, ensuring your dashboard serves as a bespoke compass for your business's legacy.
Key Takeaways
- Learn how to identify specific data points that serve as catalysts for management action rather than mere historical observations.
- Master a framework that prioritizes stability and efficiency to ensure the long-term security and earning power of your organization.
- Discover how to select the right key metrics for a finance dashboard to move from reactive reporting to predictive foresight.
- Understand how to design a streamlined reporting environment that eliminates digital clutter and focuses on high-impact results.
- Explore the importance of analyzing your current systems before choosing a software solution to ensure a seamless source of truth.
Beyond the Spreadsheet: What Defines a "Key" Metric in 2026?
A metric only earns its place on a professional dashboard when it directly informs a specific management action. While traditional reporting often dwells on what happened last month, the modern executive requires a perspective that looks toward the horizon. This evolution marks a shift from rear-view reporting to forward-looking intelligence. In an environment where the federal funds rate sits at 3.64 percent and inflation remains a factor, your key metrics for a finance dashboard must act as early warning systems rather than historical archives. If a figure doesn't prompt a change in strategy or a confirmation of path, it's likely a distraction.
To better understand this concept, watch this helpful video:
True data integrity begins with a single source of truth for finance. Without this foundation, the numbers you see are merely isolated facts scattered across different systems. To make these values truly meaningful, you must frame them within the context of market benchmarks and broader economic trends. Every performance indicator requires a baseline to reveal whether your organization is leading the pack or falling behind. This meticulous approach ensures that your leadership team isn't just reacting to internal shifts but is actively navigating the global landscape with precision.
The Difference Between Data and Insight
A well-designed dashboard doesn't just show you what occurred; it answers the vital question of what you should do next. It distinguishes between raw data and actionable insight. By utilizing financial AI solutions, leaders can now filter through the daily noise to identify significant performance signals that might otherwise be missed. This ensures that the key metrics for a finance dashboard remain focused on high-impact outcomes that protect your business's legacy. Insight is the bridge between knowing your numbers and mastering your future.
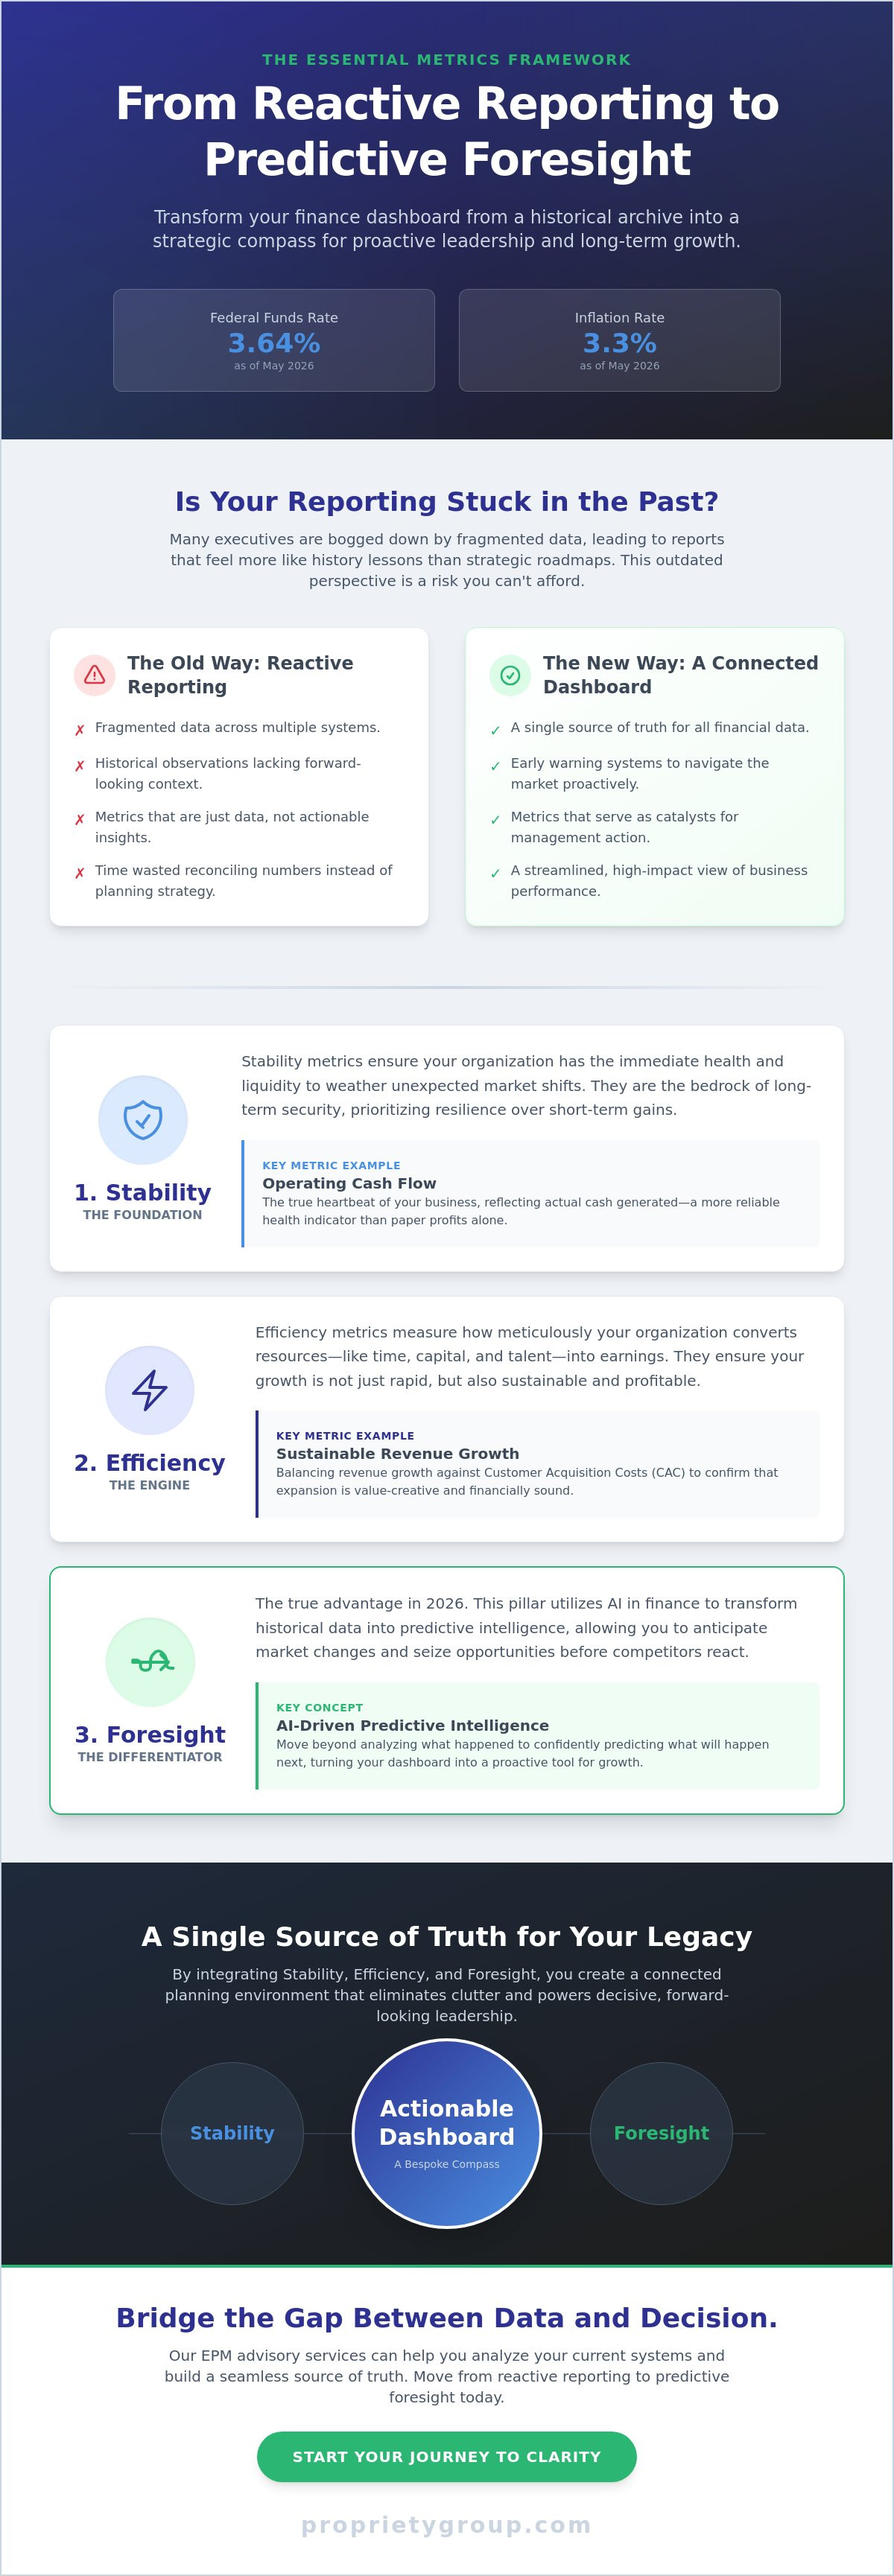
The Essential Metrics Framework: Stability, Efficiency, and Foresight
A balanced dashboard acts as the structural foundation for any enduring enterprise. To move beyond simple accounting, you must categorize your information into three distinct pillars: stability, efficiency, and foresight. While many leaders focus solely on the bottom line, a sophisticated approach requires a more holistic view. By selecting the right key metrics for a finance dashboard, you ensure that every data point serves a higher strategic purpose. This framework provides the clarity needed to navigate a market currently defined by a 3.64 percent federal funds rate and steady inflationary pressures.
Stability metrics focus on the immediate health of your organization, ensuring you have the liquidity to weather unexpected shifts. These Financial Performance Measures are essential for managers who prioritize long-term security over short-term gains. Efficiency metrics then layer on top of this foundation, measuring how meticulously your organization converts its resources into earnings. When these two pillars are strong, the business gains the freedom to look ahead with confidence. If you find your current systems struggle to produce these insights, our advisory for EPM can help refine your reporting structure.
The true differentiator for 2026 is the foresight pillar. This category utilizes ai in finance to transform historical data into predictive intelligence. It allows you to anticipate market changes before they impact your balance sheet. By integrating forward-looking indicators, your key metrics for a finance dashboard become a proactive tool for growth rather than a reactive summary of the past.
Stability and Growth Indicators
Operating cash flow remains the heartbeat of any dashboard because it reflects the actual cash generated by your core business activities. It's a much more reliable indicator of health than paper profits alone. You must also balance revenue growth against your customer acquisition costs. Rapid expansion is only valuable if it remains sustainable and doesn't compromise your integrity or long-term legacy.
Foresight: The Predictive Edge
Rolling forecast accuracy measures the gap between what you predicted and what actually occurred. In today's environment, the ability to narrow this gap is a sign of a mature, well-informed leadership team. Scenario sensitivity is equally vital. It involves tracking how external variables, such as the $16,100 standard deduction for single filers or shifts in interest rates, might influence your bottom line. This level of preparation ensures you're never caught off guard.
Building Your Dashboard: From Fragmented Data to Connected Planning
Many organizations fall into the trap of digital clutter. They believe that more charts and graphs naturally lead to better decisions. This often results in dashboard fatigue, a state where the sheer volume of information obscures the actual truth. Before you select the final key metrics for a finance dashboard, you must conduct a meticulous analysis of your current reporting environment. This ensures that every visual element serves a specific purpose. Engaging in strategic performance advisory—a process that aligns your financial technology with your leadership’s long-term goals—helps bridge the gap between raw data and meaningful action. It is about building a bespoke tool that reflects your company’s unique legacy and operational reality.
A successful transition from fragmented systems to a connected planning model requires a steady, principled approach. You aren't just moving numbers; you're creating a visionary framework for growth. This ensures that finance and operational leadership speak the same language. When your data is connected, your ability to make proactive decisions increases significantly. This thoroughness creates a sense of transparency that instills trust across the entire organization, ensuring every department understands its role in the company's success.
Choosing the Right Technology
Standard business tools often focus on simple visuals without the depth required for complex financial planning. In contrast, dedicated performance management platforms offer the structural integrity needed for sophisticated forecasting. These systems allow you to test how your business survives different financial pressures, such as sudden market shifts or rising costs, before they happen. The transition requires a meticulous approach to moving your data. If the underlying information is unreliable, the dashboard loses its authority from day one. A professional implementation ensures that your key metrics for a finance dashboard are backed by a single, verified source of truth.
Ongoing Optimization and Support
A dashboard isn't a static project you finish and forget. It's a living entity that must evolve as your business grows. As market conditions shift, your system requires regular technical assistance and system optimization to remain relevant. Managed support models, such as PG CARE, provide the expert-led narrative and long-term security your organization needs. This ongoing commitment protects your investment and ensures your financial leadership remains sharp, accurate, and ready for whatever the future holds. A well-maintained system is the key to maintaining your standard of excellence.
Mastering the Strategic Horizon of 2026
The journey from fragmented data to a unified vision requires a fundamental shift in how we perceive financial intelligence. By focusing on stability, efficiency, and foresight, you transform your reporting from a passive record into a proactive catalyst for growth. Identifying the right key metrics for a finance dashboard is more than a technical exercise; it's a commitment to clarity that allows your leadership team to move with quiet confidence. You've seen how a single source of truth and predictive intelligence can redefine your organization's legacy and provide the security needed in an evolving market.
Achieving this level of precision requires a partner who values integrity as much as innovation. At Propriety Group, we specialize in the meticulous setup of strategic performance and customer relationship systems, ensuring your technology is as refined as your strategy. Our expertise in AI-driven predictive analytics helps you anticipate market shifts before they occur, while our comprehensive PG Care support model ensures your systems remain optimized and resilient for the long term. Empower your finance team with bespoke strategic performance advisory from Propriety Group to secure your business's future. The path to confident, visionary leadership starts with a dashboard designed for permanence and purpose.
Frequently Asked Questions
What is the difference between a KPI and a metric?
A metric is a general measurement, whereas a Key Performance Indicator is a strategic data point used to track progress against specific business objectives. It's helpful to think of metrics as the raw ingredients and KPIs as the finished dish that serves a particular purpose. While a metric might track total expenses, a KPI would measure your performance against a targeted budget to ensure fiscal integrity and long-term security.
How many metrics should be on a finance dashboard?
A focused dashboard generally contains between five and nine indicators to maintain clarity and prevent information overload. This range allows you to monitor stability and growth without losing sight of your primary objectives. By meticulously selecting the key metrics for a finance dashboard, you ensure that every visual element prompts a specific management action, preserving the sophisticated and steady rhythm of your leadership.
Can AI really improve my financial metrics?
AI enhances your metrics by providing predictive intelligence that moves beyond simple record-keeping. It identifies significant performance signals within vast data sets, allowing you to forecast outcomes with greater accuracy. This technology ensures that your key metrics for a finance dashboard aren't just reflecting the past but are actively guiding you toward future prosperity by anticipating shifts in the economic landscape.
How often should a finance dashboard be updated?
Most organizations require daily or real-time updates to ensure their leadership remains agile and well-informed. While the SEC proposed a shift toward semiannual reporting for public companies in May 2026, it's essential that internal dashboards remain more frequent to provide a reliable source of truth. Regular updates allow you to spot trends early and make adjustments with the quiet confidence that your data is current and accurate.